Could the CRASH really come to Calgary?
In times of uncertainty - as more time passes with continued inflation talk, tax hikes, interest rate hikes and overall housing price crash concerns in the media - my experience shows me that there are two camps of people forming...
The camp that takes the information in, makes adjustments and continues to push forward with their life plans...
And those that take the information in, but end up in a sort of "paralysis mode", unable to decide what action to take.
Now, this may sound like I'm being a little harsh, but I'd suggest you ponder it just a second and take stock of which camp you've been finding yourself in lately.
I say this because, as Realtors, we don't help people buy and sell houses. We help people as they undergo their biggest life changes.
"It's now been 1 full quarter that Canadians have been dealing with interest rates that are at or over 2 percentage points above what we had been accustomed to for years"
People's ability to undergo these changes are certainly impacted by the external elements happening around them, but paralysis or inaction is nearly never in their best interests as life continues to push on. Things like:
. Babies entering the family
. Parents downsizing to something more manageable
. Moving cities or provinces and getting your first job
. Bringing family members from other countries to live safely with you
It's with this message that I hope to continue shedding light on the most accurate reality I can paint here in the Greater Calgary Market.
So let's get into it...
The end of September marked something interesting that I'd like you to take note of. It's now been 1 full quarter that Canadians have been dealing with interest rates that are at or over 2 percentage points above what we had been accustomed to for years.
In other words, we've now undergone a complete cycle of buyers and sellers who got into the game and made a move since the rate bumps and peak pricing in our city. This group made a move without the benefits of the ultra-low rates we'd had before and before 15-20% price increases.
Essentially, this group of buyers and sellers were only exposed to our 'new normal' - higher prices than ever and rates now back up to around historical norms. This is the group that our recent stats are based around and, in my opinion, give us a pretty clear picture of what's actually going on.
so, let's start - with the SALES SUMMARY.
Sales are down right now. Stats show around 12% fewer homes were sold last month than in September of 2021.
That is also an 11% drop from August, which is now about a 50% sales drop from our peak in March.
But looking beyond that, I would like to share 2 key points:
This past March saw sales numbers 30-40% higher than we'd ever expect at that time of year, so that earlier negative comparison isn't terribly relevant.
"Historically, this September's total sales number will go down in the history books as a Top 5 September in the Calgary Market. That's pretty good."
And secondly, September 2021 broke records in a post-Covid, high pent-up demand and ultra-low interest rate environment. So, again, not a marker that's particularly useful to compare to.
Historically, when it's just the data being considered, this September's total sales number will go down in the history books as a Top 5 September in the Calgary Market. That's pretty good, all things considered.
However, things are continuing to shape up quite differently across all 4 property types.
Detached and Semi-Detached homes are where we are seeing the main slowdown - 23 & 27% less than last year, respectively. With Detached being by far our largest sector, it's 23% year-over-year slump is what has dragged down our overall sales stats.
Reduced affordability from rate hikes results in fewer sales in single family homes in general. This is starting to show up as homes in the $600k - $1 Million price range are starting to take a little longer to sell, and we are seeing a little bump up in active inventory, too, adding to the slowdown.
Homes valued below this price bracket are hard to find and selling fast. The stuff that price point doesn't seem to be phased at all and continues to sell at the same pace as last year.
Where affordability is concerned, the sales pace for the Apartment segment continues to drive forward with incredible momentum. To put it into perspective, September had more apartment sales than in any given month in 2021.
And, if you remember, 2021 was a really fantastic overall real estate market.
Along with that, our Row Home Market - the second most affordable market - is near even with last year's pace. And that again, is saying something because of how strong Rows were at this point last year.
Let's continue to round out the message with our INVENTORY STORY.
With sales slowing overall, what is happening here is critically important. And if you've been following any of my updates for the last couple of years, you'll be very familiar with this message.
"We are in a record low active inventory position. Simply put, not a lot of new homes coming to market and not a lot of overall homes to look at."
The number of active properties on the market is very, very, very low!
Regardless of sales slowing and concerns about affordability, we are in a record low active inventory position. Simply put, not a lot of new homes coming to market and not a lot of overall homes to look at.
Now, there are a few sub-stories here,
regarding the Detached market, where things have slowed the most...
As of October 3rd, there were 453 single-family homes on the market under $500k. In the month of September there were 283 sales.
That's only 1.6 months of supply. Good sales + low inventory = Tight.
Now, looking at the $600k-$1 million price bracket, as discussed earlier, it looks like this...
331 single-family homes have sold in the last 30 days and we currently have 930 active on the market. That represents 2.8 months of inventory.
This is now in 'balanced' territory - not a seller's market.
So, we need to be absolutely dialed in when making real estate decisions today. Please ensure you are getting tactical and relevant advice from your trusted real estate advisor.
One extra thing about inventory - the active number of homes on the market for Semi-Detached, Row homes and Apartments are between 26 and 34% less than at this same time last year. That's a combined 900 fewer properties on the market to look at and buy.
The more affordable the product, the tighter the market. And as the price point creeps up, so does the inventory, just a bit.
What do you think this does for our ability to fight off a crash? It's a pretty strong case.
Let's finish off with our PRICING PICTURE.
This is the one that gets most of the headlines, most of the comments and most of the mixed messages, so I'll do my best to provide the context you need.
I like looking at this in a few different ways...
How are we doing since last year at the same time?
And how have we done during the last full quarter's buying/selling cycle?
So let's start with the year-over-year figures...
As a whole, despite the changes since the interest rate bumps, we remain between 10 and 15% higher in terms of benchmark sale price than we were at the same time last year! That's a huge win on all fronts.
Some may want to chime in and say "Well, what's happened since the market peak earlier this year?" but I would ask why that even matters because - unless you are a flipper or have had a financial hardship since being a buyer at the peak - real estate is a longer play for literally everyone else and the trend matters over years and years, not in the last few months.
"Despite the changes since the interest rate bumps, we remain between 10 and 15% higher in terms of benchmark sale price than we were at the same time last year! That's a huge win."
That being said, our house prices are down 3.4% overall since the peak, which equates to about $18k for the average home.
Specifically, though, this number differs greatly depending on location, from the satellite communities to Calgary's downtown core. We see price growth from as low as just a few percent all the way up to over 20%.
So, be careful about the information you hear and take action on.
The 2nd point I want to make concerns our most recent buying cycle - the last 90-120 days since rates skyrocketed and affordability plummeted as a result...
DETACHED PRICES
$647k to $628k - a 2.9% decline
ROW HOME PRICES
$364k to $362k - a 0.5% decline
SEMI-DETACHED PRICES
$581k to $562k - a 2.2% decline
APARTMENT PRICES
$277k to $278k - a 0.3% increase
This last bit of information tells a great story about the state of the market because buyers and sellers have come to market during the current circumstance of uncertainty, rising interest rates, spiking inflation and doing so during a quieter time of the seasonal sales cycle.
From here nobody really knows what will happen, as we'll likely get another rate. But so far, with more than a 2% increase, we've already shown prices to be pretty resilient.
Now, the most important point of this whole update...
I hate to sound like a broken record, but it remains very important for us in Alberta, and Calgary specifically, to continue to note the additional macro elements positively affecting our economy and therefore our real estate market.
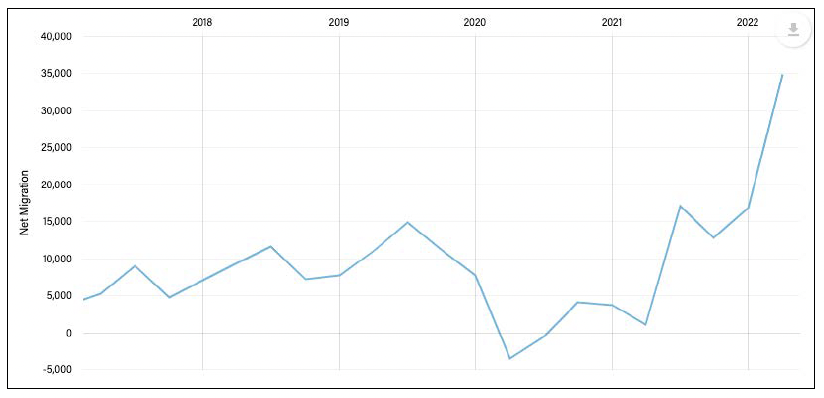
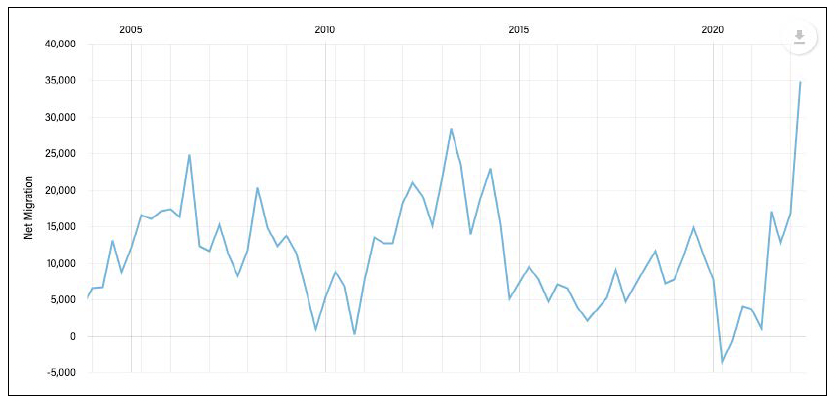
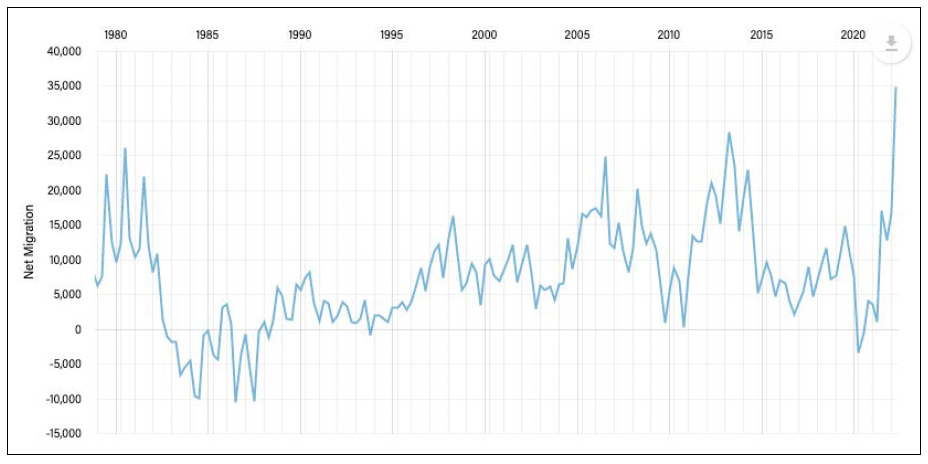
We just experienced the highest net migration to Alberta ever!! Yes, ever. Take a look at this 5-year graph. Look at the massive recent influx of people to our province!
So, it's stats like this - and like our unemployment numbers (below) - that keep painting the picture that Alberta will be a-okay during all of this.
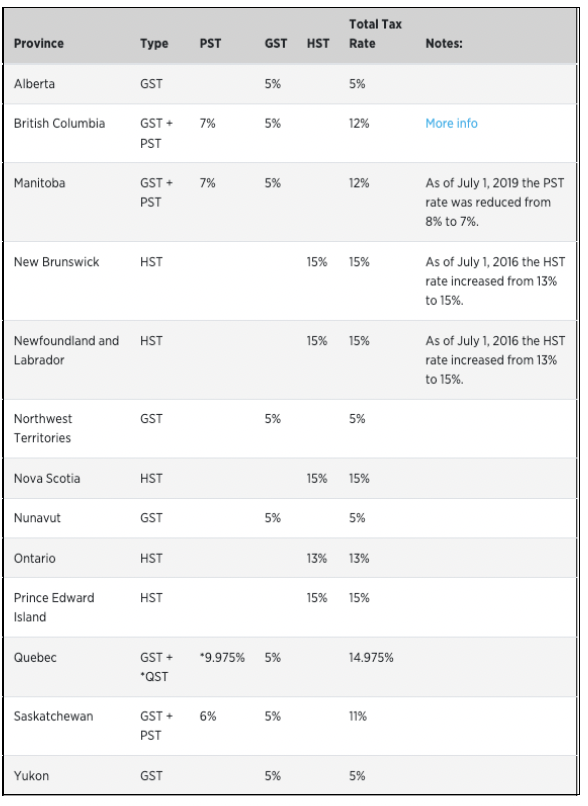
Oh! And I can't forget to talk about our tax rates here...
Yes, Alberta is the place for Canadians to prosper, to build wealth, to build retirement savings, to earn & keep the most income and to enjoy a standard of living not found anywhere else in our great country.
This isn't 'Alberta Realtor' rhetoric. No, this is cold, hard fact. And due to the housing price gap, we will be singing this song for well over half a decade to come, if not longer!
So, could the crash really come to Calgary?
My bet continues to be 'No'.
And remember... if you require any market information relating to your specific situation, please don't hesitate to reach out!
COPYRIGHT © 2020. CREATED
BY MIKE ABOU DAHER.


